A business can have customers, revenue and even growing sales while still not making a profit. The reason is simple: before profit begins, the business first needs to generate enough contribution from its sales to cover all of its fixed costs. The break-even point shows exactly where this happens — the level of sales at which total revenue equals total costs, so the business makes neither a profit nor a loss. ACCA describes break-even analysis as part of cost-volume-profit analysis, which helps businesses understand how changes in sales volume, selling price and costs affect profitability. (ACCA Global)
Fixed Costs and Variable Costs
To calculate break-even, a business first needs to separate its costs into fixed costs and variable costs. Fixed costs are expenses that usually remain relatively stable regardless of how many units are sold, such as rent, insurance or certain salaries. Variable costs increase as sales or production increase, such as materials, packaging, transaction fees or delivery costs attached to each order.
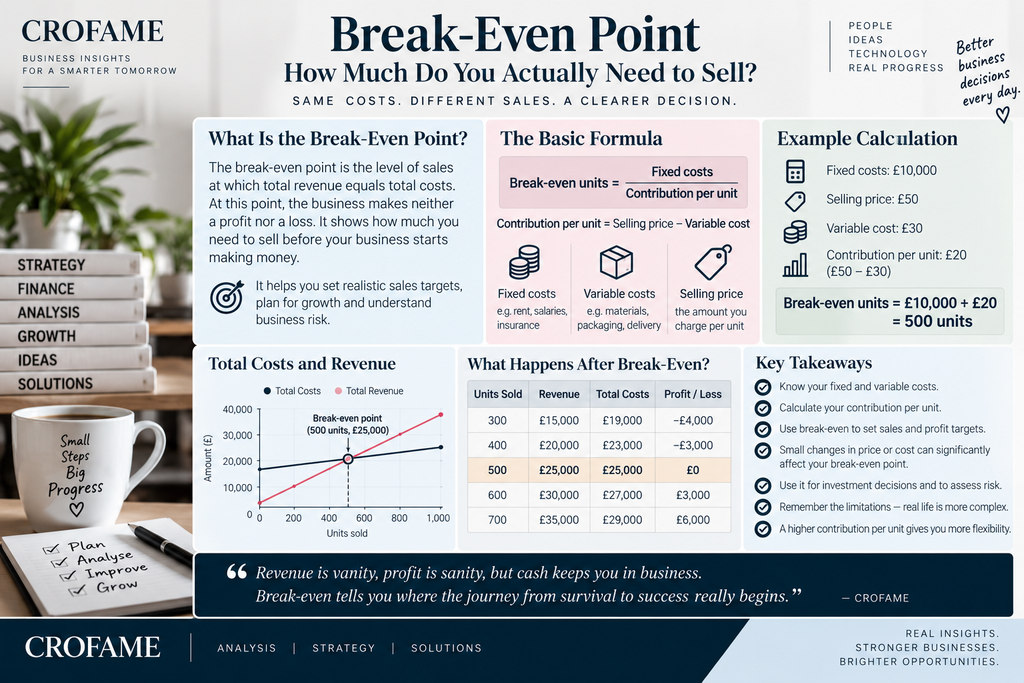
For example, a company may have monthly fixed costs of £10,000. It sells a product for £50, while the variable cost of producing one unit is £30. The difference between the selling price and variable cost is called the contribution per unit. (OpenStax)
Selling price: £50
Variable cost: £30
Contribution per unit: £20
That £20 does not immediately become profit. It first contributes towards paying the company’s £10,000 of fixed costs.
Example: How Many Units Must Be Sold?
The basic calculation is:
Break-even units = Fixed Costs ÷ Contribution per Unit
Using our example:
£10,000 ÷ £20 = 500 units
The company therefore needs to sell 500 units per month before it begins making an operating profit. At exactly 500 units, sales revenue equals £25,000, variable costs equal £15,000 and the remaining £10,000 contribution covers the £10,000 fixed costs.
Profit = £0. Loss = £0.
If the company sells 501 units, the contribution from that additional unit begins to create profit. ACCA and OpenStax both use this contribution approach to calculate break-even quantities. (ACCA Global)
Selling More Does Not Always Mean Making More Money
Break-even analysis also helps show why revenue alone can be misleading. Suppose two businesses both sell 1,000 units, but their contribution margins are different.
Business A sells its product for £50 with a £30 variable cost, producing £20 contribution per unit. Business B also sells for £50, but its variable cost is £45, producing only £5 contribution per unit.
If both have fixed costs of £10,000, Business A breaks even at:
£10,000 ÷ £20 = 500 units
Business B needs:
£10,000 ÷ £5 = 2,000 units
The companies have the same selling price and fixed costs, but Business B needs four times as many sales to break even because each sale contributes much less towards overheads.
This is why businesses should understand contribution, not just revenue.
What Happens if Costs Increase?
Break-even can change quickly when costs move. Imagine the original company still sells at £50, but variable costs rise from £30 to £35.
Contribution falls from £20 to £15 per unit.
The new break-even point becomes: £10,000 ÷ £15 = approximately 667 units
The business now needs to sell around 167 additional units every month simply to achieve the same zero-profit position it previously reached at 500 units.
The same principle applies when fixed costs increase. A business that expands into larger premises, hires additional permanent employees or introduces an expensive software contract may increase the number of sales required before profit begins.
Price Changes Can Move the Break-Even Point Too
Management may sometimes try to improve profitability by increasing prices. If the company raises its price from £50 to £55 while variable costs remain £30, contribution increases to £25 per unit.
The break-even calculation becomes:
£10,000 ÷ £25 = 400 units
On paper, the business now needs to sell only 400 units rather than 500. However, this calculation assumes customers will continue buying at the higher price. If the price increase causes demand to fall sharply, the company may still struggle to reach its target.
This is why break-even analysis is useful but should not be used alone. Pricing decisions also require an understanding of customer demand, competitors and price elasticity.
Break-Even Can Also Be Used for Target Profit
Businesses usually do not want merely to break even. They want to know how much they need to sell to achieve a particular profit.
Suppose our company wants to earn £5,000 monthly profit. Fixed costs remain £10,000 and contribution remains £20 per unit.
The calculation becomes:
(£10,000 fixed costs + £5,000 target profit) ÷ £20 = 750 units
The company therefore needs to sell 750 units to generate the target £5,000 profit. ACCA describes the same cost-volume-profit approach for calculating the sales level required to reach a desired profit. (ACCA Global)
This makes break-even analysis useful for budgeting because management can translate a financial target into an operational target.
Margin of Safety: How Far Are You From a Loss?
Another useful measure is the margin of safety, which compares actual or expected sales with break-even sales. ACCA describes it as the difference between budgeted sales and the break-even level. (ACCA Global)
If a company expects to sell 700 units but breaks even at 500, its margin of safety is:
700 − 500 = 200 units
That means sales could fall by 200 units before the company begins making an operating loss.
A company selling 520 units with a 500-unit break-even point technically makes a profit, but it has very little room for a drop in demand. Another company selling 900 units with the same break-even point has a much larger buffer.
This makes break-even analysis useful not only for profitability but also for understanding business risk.
Break-Even Can Help With Investment Decisions
The calculation can also help when management considers adding a new employee, purchasing equipment or opening another location. Instead of looking only at the additional cost, management can calculate how much extra business must be generated to justify it.
For example, a new machine increases fixed costs by £24,000 per year, but contribution is £40 per product.
£24,000 ÷ £40 = 600 additional units per year
Management now has a much clearer question: Can the business realistically sell at least another 600 units each year?
If demand supports that volume, the investment may make sense. If not, the company may need to reconsider the timing, price or cost structure.
Break-Even Analysis Has Limits
The calculation is useful because it simplifies a business problem, but the real world is less stable than the formula. ACCA notes that cost-volume-profit analysis normally assumes that selling prices and variable costs remain constant and that costs can be clearly separated into fixed and variable categories. For businesses selling several products, the calculation may also depend on maintaining a relatively consistent sales mix. (ACCA Global)
In practice, suppliers change prices, companies offer discounts, demand fluctuates and some costs are neither completely fixed nor completely variable. The break-even point should therefore be treated as a planning tool rather than a guaranteed prediction.
A Simple Number With a Useful Business Meaning
Break-even analysis answers a fundamental question: How much do we need to sell before the business actually starts making money?
A company with £10,000 of fixed costs and £20 contribution per unit needs 500 sales to break even. If costs rise, the break-even point rises. If contribution improves, it falls. If management wants a specific profit, that target can also be converted into the number of units or amount of revenue required.
That makes break-even much more than an accounting formula. It connects pricing, costs, sales targets and business risk in one simple calculation.
Category: Business Theory
Secondary category: Business Performance
Sources
ACCA — Cost-Volume-Profit Analysis. Explains contribution, break-even calculations, target profit, margin of safety and the assumptions behind CVP analysis. (ACCA Global)
OpenStax — Principles of Accounting, Volume 2: Calculate a Break-Even Point in Units and Dollars. Provides break-even calculations using fixed costs, variable costs and contribution margin. (OpenStax)
OpenStax — Explain Contribution Margin and Calculate Contribution Margin per Unit. Explains how sales revenue less variable costs produces contribution available to cover fixed costs and profit. (OpenStax)
ICAEW — Breakeven Analysis. Discusses using contribution and cost calculations to determine the minimum sales required to avoid a loss. (ICAEW)